Refer to the supply and demand graph below. In the graph, line S is the current supply of this product, while line S1 is the optimal supply from the society's perspective. This figure suggests that there is (are):
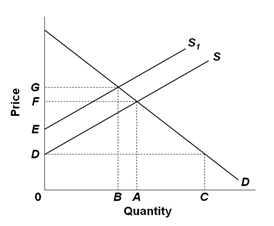
A. External benefits from the production of this product
B. External costs in the production of this product
C. Currently an underallocation of resources toward producing this good
D. Positive externalities from producing the good
B. External costs in the production of this product
You might also like to view...
Inefficiency in an economy can be caused by
A. misallocating resources. B. underemploying resources. C. discrimination. D. All of the responses are correct.
The 2009 our imports and exports added together are ___________ percent of GDP.
Fill in the blank(s) with the appropriate word(s).
Monopolists can charge any price and sell any amount of output they want because no competition exists.
Answer the following statement true (T) or false (F)
Pay disparity by race:
A. is caused by a combination of discrimination and differences in skills. B. is caused solely by discrimination. C. is caused solely by differences in skills. D. has disappeared in the last five years.