From the graph showing the Phillips curve from 2006 to 2016, we can see that the 2008 financial crisis caused ______.
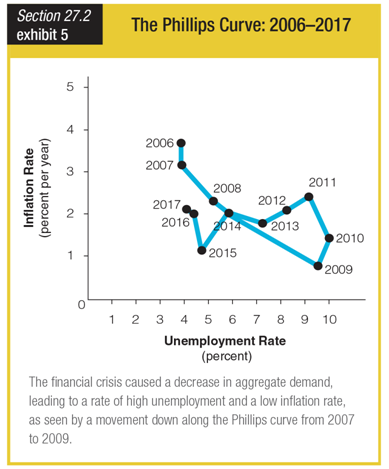
a. a downward movement along the Phillips curve
b. an upward movement along the Phillips curve
c. skyrocketing inflation and unemployment rates
d. plummeting inflation and unemployment rates
a. a downward movement along the Phillips curve
You might also like to view...
If the current level of GDP exceeds full employment, the level of GDP can be reduced by
A) reducing the money supply. B) lowering interest rates. C) increasing spending. D) reducing taxes.
The opportunity cost of an apartment in a rent controlled market is equal to
A) the rent charged for the apartment. B) the opportunity cost of searching for the apartment. C) the rent charged for the apartment plus the opportunity cost of searching for the apartment. D) nothing because of the surplus of apartments when there are rent controls. E) the rent charged for the apartment minus the opportunity cost of searching for the apartment.
The demand curve for the product of a perfectly competitive firm's demand curve indicates that if the firm
A) lowers its price, it can sell more. B) accepts the market-set price, the number of units the firm can sell is limited. C) raises its price, sales will fall to zero. D) changes its price, the quantity demanded will change in the opposite direction.
Which of the following is the set of conditions necessary for long-run equilibrium for a perfectly competitive firm?
A. P = SRMC = SRAC = LRAC B. P = SRMC = SRAC > LRAC C. P = SRMC < SRAC = LRAC D. P > SRMC = SRAC = LRAC