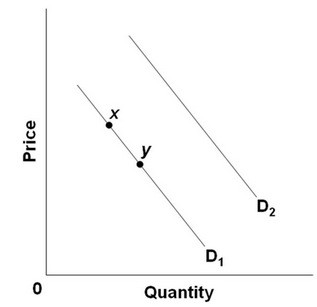
 Refer to the above diagram. A decrease in demand is depicted by a:
A. shift from D2 to D1.
B. move from point y to point x.
C. move from point x to point y.
D. shift from D1 to D2.
Answer: A
You might also like to view...
If it does not shut down, a perfectly competitive firm produces where marginal cost is equal to the marginal revenue
A) only in the short run. B) only in the long run. C) always to maximize its profit. D) only if it is not possible to produce where price equals average variable cost. E) only if it is not possible to produce where price is greater than average total cost.
Suppose Ms. Sanchez has a total income of $200,000, has a taxable income of $120,000, and pays $40,000 in taxes. Considering the information, what is Ms. Sanchez's nominal tax rate?
A. 20.0 percent. B. 33.3 percent. C. 60.0 percent. D. 18.5 percent.
Suppose that the labor market for life guards is initially in equilibrium. Then swimming pool owners adopt a new labor-saving technology that uses computers to monitor the locations of swimmers in the pool. What happens to the equilibrium wage and quantity of life guards?
a. Both the equilibrium wage and quantity increase. b. Both the equilibrium wage and quantity decrease. c. The equilibrium wage increases, and the equilibrium quantity decreases. d. The equilibrium wage decreases, and the equilibrium quantity increases.
Suppose there are only two goods (Good A and Good B) and the average person buys 8 of Good A in a year and 6 of Good B. If the Price of Good A is $8 and the Price of Good B is $6, the price of the market basket
A. is 50. B. is 36. C. is 100. D. is 64.