Refer to the graph below, showing the long-run supply and demand curves in a purely competitive market. We know that when this market reaches equilibrium, the marginal:
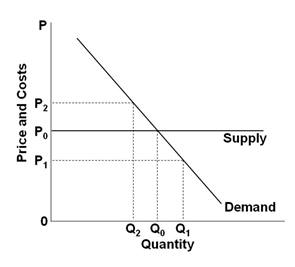
A. Cost equals marginal benefit
B. Benefit exceeds marginal cost
C. Cost exceeds marginal benefit
D. Cost equals zero
A. Cost equals marginal benefit
You might also like to view...
Refer to the scenario above. A firm producing Good Y will continue production in the short run if total revenue exceeds ________
A) $25,000 B) $60,000 C) $85,000 D) $35,000
In the Solow growth model, given the values of A, s, n, and d, the economy has an equilibrium growth rate of real GDP equal to
A) s. B) n. C) n + d. D) n - d. E) s - d.
Which of the following reduces U.S. potential for economic growth by reducing household incentive to use private property most efficiently and effectively?
(a) Personal income taxes (b) Farm subsidies and import tariffs (c) Auto bailouts (d) Regulation in the health care industry
Major trading partners with the United States have not changed significantly over the last several decade with the exception of trade with
A) the United Kingdom. B) Mexico. C) China. D) Canada.