The graph below shows the number of students enrolled in various courses at State University in spring 2000. Each bar represents a different course, and the height of the bar represents the number of students enrolled. Use the graph to answer the question.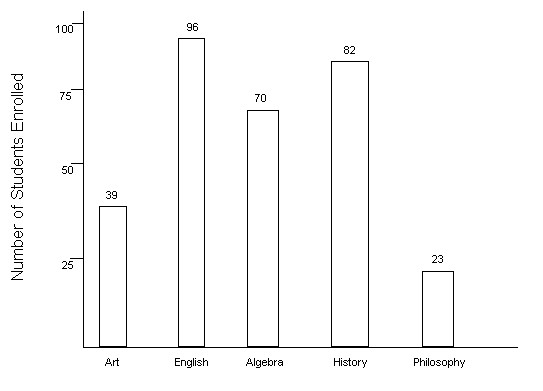 Which course had the highest enrollment?
A. Algebra
B. English
C. Philosophy
D. History
Answer: B
Mathematics
You might also like to view...
Find v ? u.v = -2i + 4j and u = 8i + 6j
A. -40 B. 6i + 10j C. -16i + 24j D. 8
Mathematics
Solve the problem.A company predicts that sales will increase rapidly after a new product is released, with the number of units sold weekly modeled by N = 7000(0.2)0.5t, where t represents the number of weeks after the product is released. What is the expected upper limit on the number of units sold per week?
A. 1400 units B. 7000 units C. 8400 units D. 9100 units
Mathematics
How many lines are determined by 8 points if no 3 points lie on a straight line?
Fill in the blank(s) with the appropriate word(s).
Mathematics
For the given functions f(x) and g(x), find f(x) ? g(x).f(x) =  , g(x) =
A. -1
B. 1
C. 
D. 
Mathematics