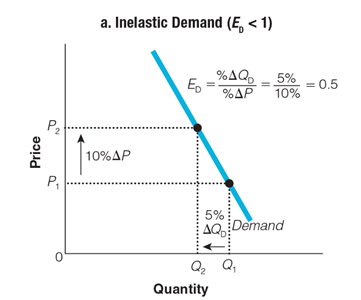
How does this graph indicate inelastic demand?

a. The distance between Q1 and Q2 is the same as the distance between P1 and P2.
b. The distance between Q1 and Q2 is less than the distance between P1 and P2.
c. The distance between Q1 and Q2 is slightly more than the distance between P1 and P2.
d. The distance between Q1 and Q2 is much more than the distance between P1 and P2.
b. The distance between Q1 and Q2 is less than the distance between P1 and P2.
You might also like to view...
Using the table provided above to construct Lorenz curves representing 1990 and 2011, what do you discover and how is this interpreted?
A) The Lorenz curve for 1990 is further away from the line of equality than the curve for 2011. This means that inequality is decreasing. B) The Lorenz curve for 1990 is further away from the line of equality than the curve for 2011. This means that inequality is increasing. C) The Lorenz curve for 2011 is further away from the line of equality than the curve for 1990. This means that inequality is increasing. D) The Lorenz curve for 2011 is further away from the line of equality than the curve for 1990. This means that inequality is decreasing.
Which of the following is not an important contribution of the agricultural sector to overall development:
a. increasing national food supplies b. permitting foreign exchange earnings through imports c. allowing excess labor to flow to urban areas d. providing savings for industrial investment e. increasing the demand for manufactured goods g. All of the above are important contributions.
There is no possibility of further widening of the European Union
Indicate whether the statement is true or false
Crises that occasionally hit financial markets will increase the demand for money since:
A. the risk of holding money relative to other financial assets decreases. B. the return on financial assets increases. C. the return on money increases. D. there is no risk with holding money.