Solve the problem.The paired data below consist of the test scores of 6 randomly selected students and the number of hours they studied for the test. Find the equation of the least-squares regression line that models the data.
A. y ? 33.7 - 2.14x
B. y ? -67.3 + 1.07x
C. y ? 67.3 + 1.07x
D. y ? 33.7 +2.14x
Answer: C
You might also like to view...
Graph the ellipse. Label the intercepts.4x2 + y2 - 100 = 0
A. (-10, 0), (10, 0), (0, -5), (0, 5)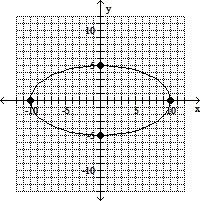
B. (-5, 0), (5, 0), (0, -2), (0, 2)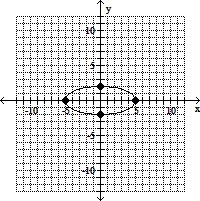
C. (-5, 0), (5, 0), (0, -10), (0, 10)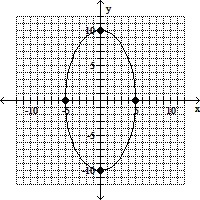
D. (-2, 0), (2, 0), (0, -5), (0, 5)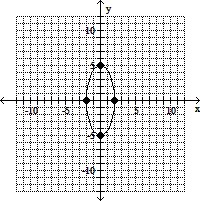
Solve the problem.The price p and the quantity x sold of a certain product obey the demand equation p = -  x + 140, 0 ? x ? 560.What quantity x maximizes revenue? What is the maximum revenue?
A. 560; $19,600 B. 420; $14,700 C. 280; $19,600 D. 140; $14,700
Draw a scatter plot of the data given in the table.The number (y) of web pages created by a large multimedia firm for each year x from 1993 to 1998 is given in the following table. number of web pages
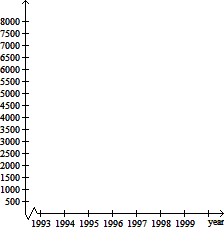
A. number of web pages
B. number of web pages
C. number of web pages
D. number of web pages
Solve the problem.By how many orders of magnitude do a $20 bill and a nickel differ?
A. 1.6 B. 0.7 C. 2.6 D. 3.3