Refer to the diagram. Arrows (3) and (4) represent:
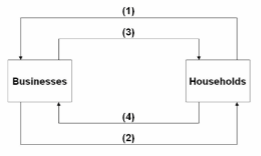
A. goods and services respectively.
B. incomes and consumer expenditures respectively.
C. resources and goods respectively.
D. consumer expenditures and income respectively.
B. incomes and consumer expenditures respectively.
You might also like to view...
Eurobanks can offer a ________ rate on dollar loans and a ________ rate on dollar deposits than their domestic U.S. competitors
A) higher, lower B) lower, higher C) lower, lower D) higher, higher
Figure 15-3
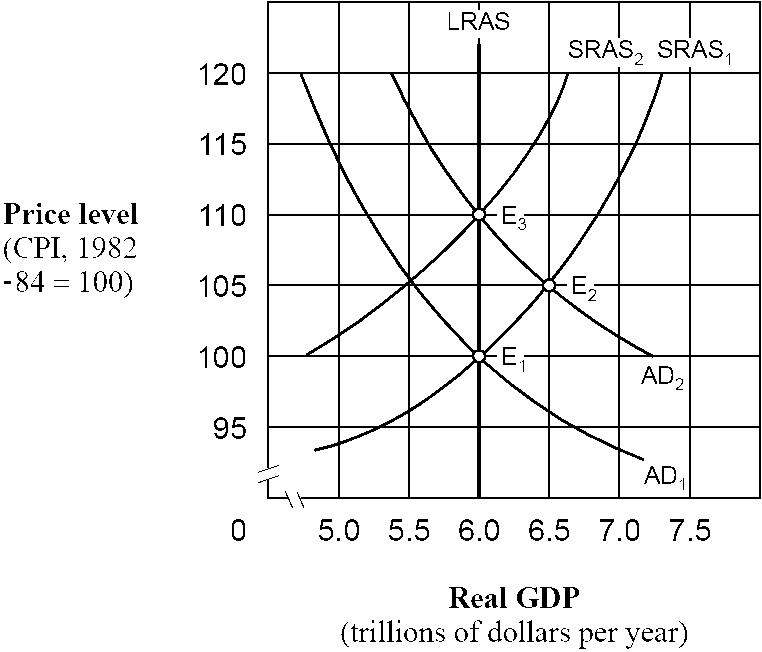
As shown in , if people behave according to rational expectations theory, an increase in the aggregate demand curve from AD1 to AD2 will cause the economy to move
a.
directly from E1 to E3 and then remain at E3.
b.
directly from E1 to E2 and then remain at E2.
c.
from E1 to E2 initially and then eventually move back to E1.
d.
from E1 to E2 initially and then eventually move to E3.
The strategy for the shared monopoly is
A. to sell a marginally higher quantity of goods than the rival. B. to take account of the effect of its own behavior on the rival firm's quantity choice. C. to sell at a marginally lower price than the rival. D. collusion.
In a "superstar economy," companies try to find only the very best talent. What effect has this had on labor markets?
A. There is a widening gap in income between people who are competent and people who are the very best. B. Per capita income has dropped because the "superstars" tend to save, rather than spend, their large salaries. C. The income gap has narrowed as the "superstars" come up with ideas to produce in ways that boost the pay of lower-income workers. D. Unemployment tends to increase because one top employee may replace two or three less competent employees.