Solve the problem.The following data represents the average percent of possible sunshine for a certain city in Indiana. 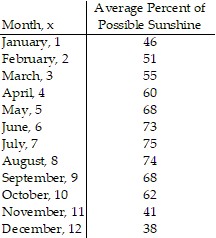 Draw a scatter diagram of the data for one period. Find the sinusoidal function of the form
 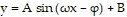 that fits the data. Draw the sinusoidal function on the scatter diagram. Use a graphing utility to find the sinusoidal function of best fit. Draw the sinusoidal function of best fit on the scatter diagram.
What will be an ideal response?
y = 15.99 sin (0.57x - 2.29) + 60.62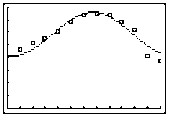
Mathematics
You might also like to view...
Determine the indefinite integral. Check your work by differentiation. dx
dx
A. 2 -
-  + C
+ C
B.  - 2
- 2 + C
+ C
C. -  -
-  + C
+ C
D. C
Mathematics
Express the area of the region bounded by the given line(s) and/or curve(s) as an iterated double integral.The lines  ,
,  , and
, and 
A. 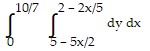
B. 
C. 
D. 
Mathematics
Solve the system of linear equations. x +
x +  y = 4
y = 4 x - 2y = 21
A. No solutions B. (6, -8) C. Infinitely many solutions D. (-6, 8)
Mathematics
Multiply.(x + 1)(x2 - x + 1)
A. x3 + 2x2 + 2x + 1 B. x3 + 1 C. x3 - 1 D. x3 - 2x2 - 2x - 1
Mathematics