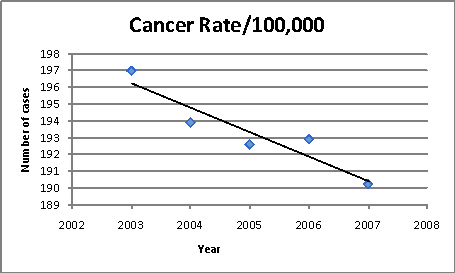
 The above graph is a graph of cancer rate per 100,000 males over the date specified. Answer the following questions based on the graph.1. What conclusion can you make concerning the cancer rate from 2003 to 2007?2. What was the approximate rate in 2007?3. If the rate continues the same, what would you predict the rate would be in 2008?
What will be an ideal response?
1. The rate is decreasing.
2. It was a little over 190 cases/100,000.
3. It would be approximately 189 cases/100,000.
You might also like to view...
The innermost lining of the uterus is called the:
A) myometrium. B) perimetrium. C) endometrium D) vasometrium.
How do Beckman Coulter and Abbott instruments count red cells and platelets?
a. Florescent staining and enumeration b. Survival staining and conductivity c. Optical scatter d. Electrical impedance
The acronym LMP refers to the ____.
A. first day of a woman's last menstrual period B. date of a woman's first menstrual cycle C. last day of a woman's last menstrual period D. estimated date of a woman's next menstrual period E. date a woman was confirmed to be in menopause
List some precautions regarding the use of an EOA.
What will be an ideal response?