The bar graph shows the percentage of adults that use the Internet for specific tasks. Use the graph to represent the given set using the roster method.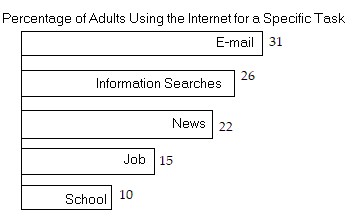 the set of tasks in which usage exceeds 20%
A. {e-mail, information searches, news, job}
B. {job, school}
C. {e-mail, information searches, news}
D. {e-mail, information searches}
Answer: C
Mathematics
You might also like to view...
Determine the domain and range of the function. Then graph it.f(x) =  - 1
- 1
A. domain = (-?, ?), range = (-?, ?)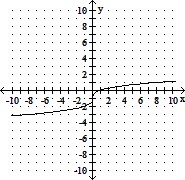
B. domain = [0, ?), range = [-1, ?)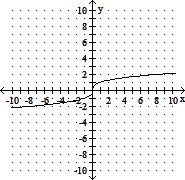
C. domain = (-?, ?), range = (-?, ?)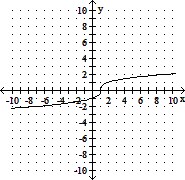
D. domain = [-1, ?), range = [0, ?)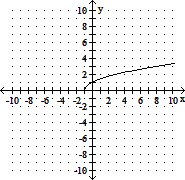
Mathematics
Solve.2x2 + xy - y2 = 3x2 + 2xy + y2 = 3
A.  and
and 
B.  and
and 
C.  and
and 
Mathematics
Determine whether the given sequence is arithmetic, geometric, or neither. If the sequence is arithmetic, find the common difference; if it is geometric, find the common ratio.{3n2}
A. Arithmetic; d = 3
B. Geometric; r = 3
C. Geometric; r = 
D. Neither
Mathematics
Find the product.
A. 
B. 
C. 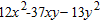
D. 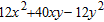
E. 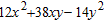
Mathematics