Which of the diagrams best portrays the effects of a substantial reduction in government spending?
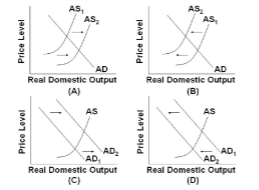
Use the following diagrams for the U.S. economy to answer the following question.
A. A.
B. B.
C. C.
D. D.
D. D.
You might also like to view...
Refer to A Negative Externality Problem. According to Pigou, the socially optimal level of production is
Demand for a good is given by Q = 100 - P. The private marginal cost of production is MCP = 10 + Q. There is a $10 per unit negative production externality in this situation. a. 0 units. b. 30 units. c. 40 units. d. 45 units.
In an increasing cost industry, an unexpected decrease in demand would lead to ____ costs and a ____ price in the long run? a. higher; higher. b. higher; lower
c. lower; lower. d. lower; higher.
Money is the only asset that functions as a store of value
a. True b. False Indicate whether the statement is true or false
Improved technology has reduced the risk of grain loss during storage. If wheat farmers expect wheat prices to rise substantially in about four months from now, which of the following is likely to be true?
a. The current supply of wheat will decline, as farmers store wheat in anticipation of the higher prices. b. The price of wheat breads is likely to decline in the future. c. The expectation of higher prices in the future is unlikely to have any impact on current wheat supply. d. The supply of wheat is likely to increase immediately.