Solve the problem.Find the graph that matches the given table.
A. 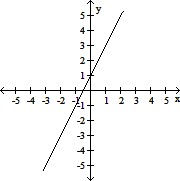
B. 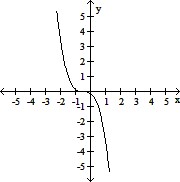
C. 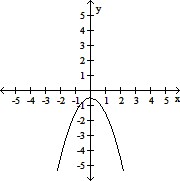
D. 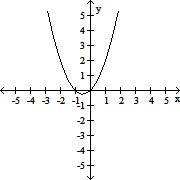
Answer: D
You might also like to view...
Convert to base ten.130five
A. 640 B. 650 C. 60 D. 40
Use multiplication to check the answer. If an answer is incorrect, find the correct answer.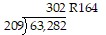
A. Correct B. Incorrect; should be 302 R264 C. Incorrect; should be 303 D. Incorrect; should be 302 R154
Solve the problem.The paired data below consist of the costs of advertising (in thousands of dollars) and the number of products sold (in thousands). (i) Use a graphing calculator to fit a linear sequence regression function an = an + b to the data, where n is the cost of advertising (in thousands of dollars) and an is number of products sold (in thousands). (ii) Use this function to estimate the number of products sold if the cost of advertising is $14,000.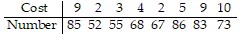
A. (i) an = 3.02n + 55.8; (ii) 101.56 thousand products B. (i) an = 2.73n + 34.8; (ii) 91.86 thousand products C. (i) an = 5.79n + 94.3; (ii) 39,115.8 products D. (i) an = 2.79n + 55.8; (ii) 94.86 thousand products
Simplify, then write in descending order.-5m2 - 6m4 + 2 + m2 - 10m3 - 8 + 14m + 12m4
A. -6m4 - 10m3 + 5m2 + 14m - 7 B. 8m7 - 4m3 - 2 C. 7m4 - 10m3 + 14m - 8 D. 6m4 - 10m3 - 4m2 + 14m - 6