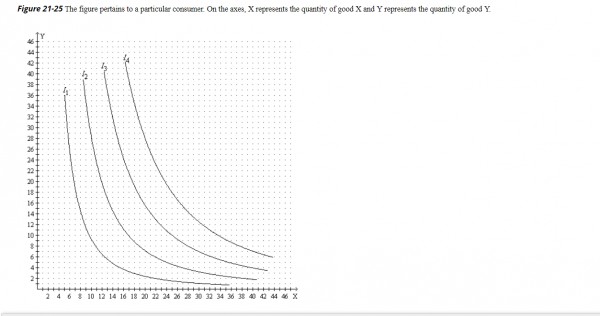
Refer to Figure 21-25. Suppose the price of good X is $10, the price of good Y is $5, and the consumer’s income is $210. Then the consumer’s optimal choice is represented by a point on which curve?
a. I4
b. I2
c. I3
d. I1
Ans: b. I2
You might also like to view...
Consider a perfectly competitive firm with MC = 10 + q. If market demand is Q = 100 - P and the current industry output is 80 units, then the firm will produce
a. zero units. b. 10 units. c. 20 units. d. the answer cannot be determined without knowing what the supply curve is.
Which of the following public policies is an example of a price ceiling?
A) Support prices for agricultural commodities B) Minimum wage laws C) Rent control program D) all of the above
The goals of monetary expansion and inflation that were advocated by followers of William Jennings Bryan:
a. were never accomplished in the 19th century. b. were achieved through the passage of the Sherman Silver Purchase Act of 1890. c. were ultimately accomplished because of increased supplies of gold. d. were eventually adopted as part of the Republican Party's platform.
Which of the following is most likely to be TRUE?
A) Income elasticity of demand for fur coats exceeds that of oatmeal. B) Income elasticity of demand for oatmeal exceeds that of fur coats. C) Income elasticity of demand for fur coats equals that of oatmeal. D) It is not possible to make any prediction about relative income elasticities.