Refer to the figure below.________ inflation will eventually move the economy pictured in the diagram from short-run equilibrium at point ________ to long-run equilibrium at point ________. 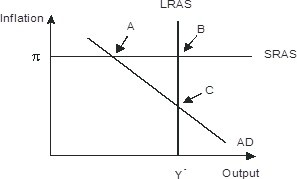
A. Rising; A
B. Falling; A; C
C. Falling; B: C
D. Rising; A; C
Answer: B
You might also like to view...
The Gini ratio is a measure of
A) income inequality. B) wealth distribution. C) income distribution. D) income as compared to wealth.
Other things remaining unchanged, which of the following is a determinant of the quantity supplied of a good?
a. The cost of inputs used in production b. The price of the product c. The income levels of consumers d. The price expectations of producers e. The preferences of consumers
The planning horizon refers to the short run, when the firm must plan how much of a variable input to apply to a fixed input
a. True b. False Indicate whether the statement is true or false
The threshold income level originally used to determine official poverty statistics was based on
A. a per capita income of $1,000 in 1958 prices. B. standards provided by the United Nations based on studies done in poor countries around the world. C. the highest income of the lowest one-fifth of families in the country. D. an income three times the amount of money needed to purchase a nutritionally adequate diet.