Draw a graph that shows the relationship of education for females and infant mortality rates. Appropriately label the x and y axes.
What will be an ideal response?
x-axis should be labeled with increasing years of education, y-axis should be labeled with increasing rates of infant mortality. Graph should show a decline in infant mortality rates as years of education increase. Please include X and Y axis label, appropriate scales on the axes, and a legend.
You might also like to view...
One of the environmental problems with gold mining is the leach ponds that contain ____________________
Fill in the blanks with correct word
Which of the following correctly states the pressure changes as a cold front passes through an area?
A. The pressure drops in advance of the front and then rises after the front passes. B. The pressure drops in advance of the front and then drops further after the front passes. C. The pressure rises in advance of the front and then drops after the front passes. D. The pressure rises in advance of the front and then rises further after the front masses.
Using this plot of annual peak discharge, what is the probability each year that a flood of 1,000 cubic meters per second will occur?
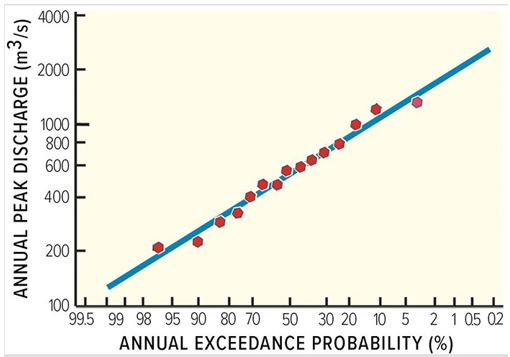
A) 1 in 1,000, or 0.01%
B) 1 in 100, or 1% (100-year flood)
C) Between 10% and 20%
D) More than 20%
The Law of the Sea Treaty extended territorial waters of coastal nations to a
A. 200-mile limit. B. 3-mile limit. C. 100-mile limit. D. 12-mile limit.