Figure 10-6
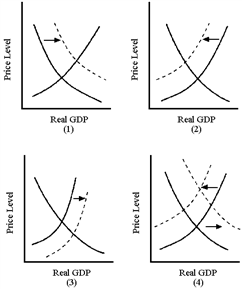
In Figure 10-6, which graph best illustrates the effect of the beginning of the Iraq war in 2003?
a.
(1)
b.
(2)
c.
(3)
d.
(4)
b
You might also like to view...
A tariff is a
A. tax. B. price ceiling. C. subsidy. D. quantity limit.
In the Brander-Spencer model the subsidy raises profits by more than the subsidy because of
A) the "multiplier" effect of government expenditures. B) the military-industrial complex. C) the forward and backward linkage effects of certain industries. D) the deterrent effect of the subsidy on foreign competition. E) the economies of scale once the company enters the market.
Recall the Application about the response of bike messengers in Zurich to a change in wages to answer the following question(s).Recall the Application. A study of bike messengers in Zurich showed that as the messengers' revenue share increased from 40% to 50%, their:
A. efforts decreased but their incomes still increased. B. efforts increased but their incomes still decreased. C. efforts decreased causing their incomes to decrease. D. efforts increased causing their incomes to increase.
In the United States in 1933, ________ people were unemployed.
A. 250,000 B. 1.5 million C. 13 million D. 51 million