The following graph shows the monthly sales for Big "D" Sales during 2000 and 2001. Use the graph to solve the problem.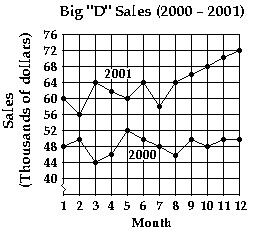 How much more was earned in the first six months of 2001 than in the first six months of 2000?
A. $18,000
B. $652,000
C. $12,000
D. $76,000
Answer: D
Mathematics
You might also like to view...
Provide an appropriate response.Multiply the fractions and reduce:  ?
? 
A. 
B. 
C. x - 5
D. 
Mathematics
Change the fraction or mixed number into an equivalent decimal. Use bar notation to write repeating decimals. 
A. 1.5
B. 1.59
C. 1.5
D. 1.58
Mathematics
Solve the formula for the specified variable.S = 2?rh + 2?r2 for h
A. h = S - r
B. h = 
C. h = 2?(S - r)
D. h =  - 1
- 1
Mathematics
Solve the system of equations.x2 + y2 = 34x2 - y2 = 16
A. (5, 3), (-5, 3), (5, -3), (-5, -3) B. (5, -3), (5, 3) C. (5, 3), (3, 5), (-5, -3), (-3, -5) D. (-5, -3), (-3, -5)
Mathematics