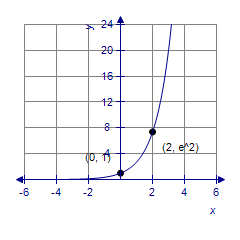
Find the value of b that would cause the graph of y = bx to look like the graph below.
?
?
A. 
B. 
C. 
D. 
E. 
Answer: C
You might also like to view...
Solve the problem.The table shows the population of a certain city in various different years. Use regression to find values for a and b so that f(x) = axb models this data, where x represents the number of years since 1980 and f(x) is the population of the city in hundreds of thousands. Round your answers to 5 significant digits.
A. a ? 1.8506, b ? 0.51209 B. a ? 2.6352, b ? 0.47558 C. a ? 2.1375, b ? 0.44316 D. a ? 1.7025, b ? 0.53750
What are core competencies and distinctive competencies and how do they lead to competitive advantage?
What will be an ideal response?
Solve. Give your answer as a mixed number if appropriate. =
= 
A. 99
B. 2
C. 33
D. 
Find a cubic polynomial in standard form with real coefficients having the given zeros.4 and -3 - i
What will be an ideal response?