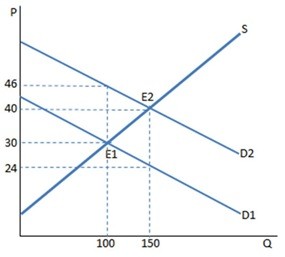
 The graph shown shows a subsidy to buyers. Before the subsidy is put in place, the buyers bought ________ units and paid ________ for each of them.
A. 150; $24
B. 100; $30
C. 150; $40
D. 100; $46
Answer: B
You might also like to view...
Suppose the price of a good rises. When will the resulting income effect reduce the quantity demanded of the good?
a. Always. b. Whenever the good is a non-Giffen good. c. Only when the good is normal. d. Only when the good is inferior.
The rise in agricultural discontent in the late 19th century can be best explained by
a. the rise of railroad cartels in the Midwest. b. the rise of global market forces not easily observed by the farmers. c. a decline in the value of agricultural exports from 1870 to 1900. d. predatory lending by banks, resulting in increased farm repossessions.
Rational utility maximizing consumers tend to:
A. buy the same bundle of goods regardless of the prices charged. B. choose the same bundle of goods regardless of their income. C. change their consumption choices when either prices or income changes. D. change their consumption choices only when both prices and income changes simultaneously.
To attract more bidders, and more aggressive bidders, to your auction
a. reveal all of the relevant information about the value of the object b. don't allow bidders to know how others are bidding c. do not allow potential bidders to examine the object too closely d. do not hold oral auctions