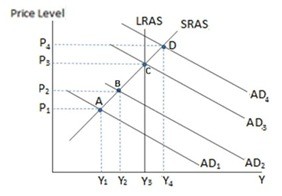
 According to the graph shown, if the government decides to increase taxes, it is most likely at equilibrium:
A. A
B. B
C. C
D. D
Answer: D
You might also like to view...
In 1971, President Nixon concluded the_______ era in this country by ____________
Fill in the blank(s) with the appropriate word(s).
The basic task of economics is to
A) explain the tax and expenditure policies of governments. B) report on key economic indicators, such as GDP and unemployment. C) explain the forces that underlie human decision making. D) predict the future movements of the stock market.
Refer to the accompanying figure. If Laura and Chris are the only two consumers in this market then at a price of $2.50 per pound, the market demand for hamburger is: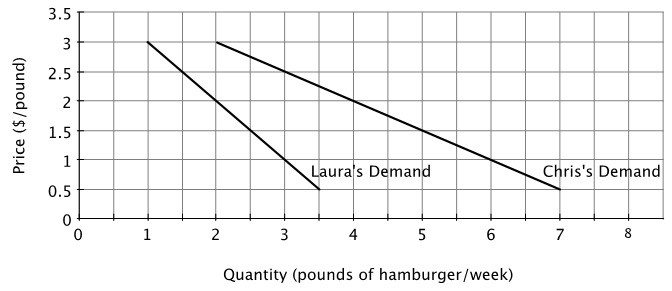
A. 3 pounds per week. B. 4.5 pounds per week. C. 1.5 pounds per week. D. 4 pounds per week.
The quantity theory of money implies that an increase in the money supply will ultimately:
A. affect only the level of real GDP; the price level will remain unchanged. B. increase the price level and leave real GDP unchanged. C. increase the price level and the level of real GDP. D. decrease the price level and the level of real GDP.