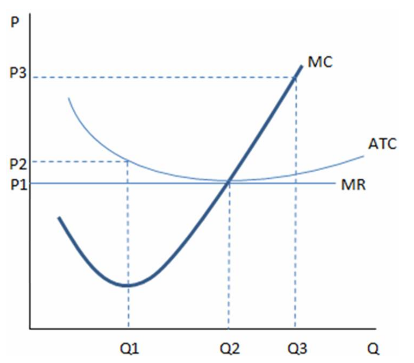
According to the graph shown, the long-run output decision for this firm is:
This graph represents the cost and revenue curves of a firm in a perfectly competitive market.
A. Q1, P1.
B. Q1, P2.
C. Q2, P1.
D. Q3, P3.
C. Q2, P1.
You might also like to view...
If Marlowe obtains 9 units of utility per dollar spent on apples and 6 units of utility per dollar spent on oranges, then Marlowe
A) should buy more oranges and fewer apples. B) is maximizing total utility. C) should buy more apples and fewer oranges. D) should buy fewer oranges and fewer apples.
Lenders are typically compensated for the risk of default with
A. Shares of the company's profits. B. Above-average interest rates. C. Dividend payments. D. Bonds.
Which of the following is considered a barrier to entry?
A.) Price taking B.) Standardized products C.) Brand Loyalty D.) Economic profit
Most U.S. government spending is financed by
A. an expansion of the money supply. B. taxes. C. government securities. D. transfer payments. E. loans from foreign countries.