Solve the problem.The following data represents the normal monthly precipitation for a certain city in Arkansas. 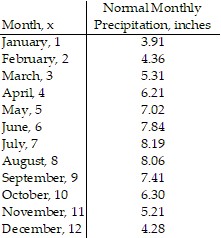 Draw a scatter diagram of the data for one period. Find the sinusoidal function of the form
 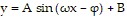 that fits the data. Draw the sinusoidal function on the scatter diagram. Use a graphing utility to find the sinusoidal function of best fit. Draw the sinusoidal function of best fit on the scatter diagram.
What will be an ideal response?
y = 2.17 sin (0.49x - 1.88) + 6.02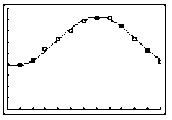
Mathematics
You might also like to view...
Factor out the common binomial factor as the GCF.(m + 5)(2 - n) + (p - 5)(2 - n)
A. (m- p)(2 - n) B. m(2 - n) + p C. (p - m)(2 + n) D. (m + p)(2 - n)
Mathematics
For the region R, find the horizontal line y = k that divides R into two subregions of equal area.R is the region bounded by y = 8 - x, the x-axis, and the y-axis.
A. k = 8 - 
B. k = 8 + 4
C. k = 8 - 4
D. k = 1 - 4
Mathematics
Find the exact value of the expression.sin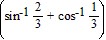
A. 
B. 
C. 
D. 
Mathematics
Use the Pythagorean Theorem to find the missing side of the right triangle.
A. 2
B. 22
C. 4
D. 
Mathematics