In graphical form,the effect of imposing a tax on a good is shown as
A. a downward movement along the market supply curve.
B. a leftward shift of the market supply curve.
C. a rightward shift of the market supply curve.
D. no change to the market supply curve.
Answer: B
You might also like to view...
Based on the figure below. Starting from long-run equilibrium at point C, a tax cut that increases aggregate demand from AD to AD1 will lead to a short-run equilibrium at point ________ and eventually to a long-run equilibrium at point ________, if left to self-correcting tendencies. 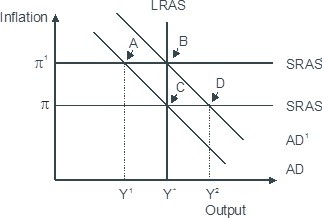
A. D; C B. B; C C. B; A D. D; B
You are an economist for the City Subway Commission. Presently, the price of a subway ride is 80¢, and 200,000 seats are filled weekly. The price elasticity of demand for subway rides is -0.40, and the income elasticity of demand is -0.60.
(i) The Commission wants to ensure that the subway has enough excess capacity to handle any extra demand that might occur during an economic decline. If a recession lowered area incomes by 5%, how many additional seats per week would the subway need? (ii) The Commission has just approved a subway price increase of 10¢ per ride. The Commission wants to know if it can use the opportunity to retire two aging subway cars that each provide 8,000 seats weekly. When the price hike goes into effect, can neither, one, or both cars be retired?
Technological progress is one of the mechanisms by which economies can grow
Indicate whether the statement is true or false
If a decision maker uses marginal analysis, then the relevant costs are the
A. full costs of a particular activity or product. B. fixed costs that do not vary with the extra activity or output. C. profits obtained on the activity or product. D. average costs for a particular activity or product. E. additional costs of a particular activity or product.