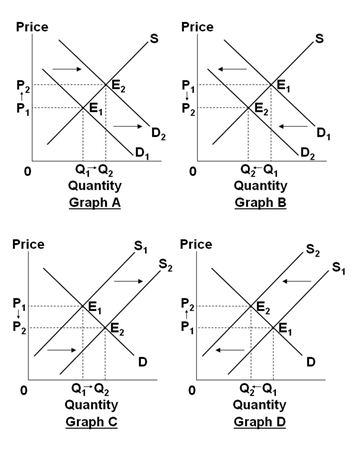
Select the graph below that best shows the change in the market specified in the following situation: In the market for gasoline, when the price of oil, which is used to produce gasoline, increases because of reduced production by major oil-producing
nations.
Assume that the graphs show a competitive market for the product stated in the question.
A. Graph A
B. Graph B
C. Graph C
D. Graph D
D. Graph D
You might also like to view...
What is the great advantage of adjudication over legislation in the management of negative externalities?
A) Adjudication has lower costs. B) Adjudication maintains the continuity of expectations. C) Courts are bound by the rule of law and legislatures are not. D) Courts can act more quickly than legislatures. E) There are no clear answers in such cases.
Banks can lower the cost of information production by applying one information resource to many different services. This process is called
A) economies of scale. B) asset transformation. C) economies of scope. D) asymmetric information.
The welfare program earmarked for the purchase of only some goods (and not others) accepted primarily at retail stores and supermarkets is known as
a. food stamps b. AFDC c. Medicaid d. Medicare e. Social Security
Mauritius, an island off the coast of Africa, competes with other countries producing goods with low-skilled labor. In 2006, it was reported that its "...factories have been exposed to ... competition from China, India, and other Asian mass producers." As a result, "the main export industry has seen a 30% reduction in volume..." The decrease in exports will cause __________ and the price level will __________.
a) a downward shift in the AE curve; decrease as the AD curve shifts leftward in the short run b) an upward shift in the AE curve; increase as the AD curve shifts rightward in the long run c) a leftward shift in the AD curve; fall in the short run and rise in the long run d) a leftward shift in the AD curve; rise in the long run as goods become more scarce.