Refer to the information provided in Figure 2.5 below to answer the question(s) that follow.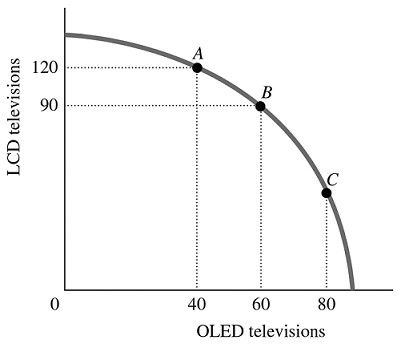 Figure 2.5Refer to Figure 2.5. The marginal rate of transformation in moving from Point B to Point A is
A. -2/3.
B. -3/4.
C. -1.5.
D. -20.
Answer: A
You might also like to view...
The demand for loanable funds curve illustrates
A) the quantity of loanable funds demanded at any given level of disposable income. B) how the quantity of loanable funds demanded changes when the people's expectations about their future income changes. C) how the quantity of loanable funds demanded changes when wealth changes. D) the quantity of loanable funds demanded at any given level of the real interest rate. E) the quantity of loanable funds supplied to the loanable funds market at any given level of disposable income.
_____ looks at how an organization does its work: activities pursued to accomplish specific objectives for specific customers.
A. Job analysis B. Market analysis C. Job structure D. Supply chain analysis
Italy has an absolute advantage in the production of which product?
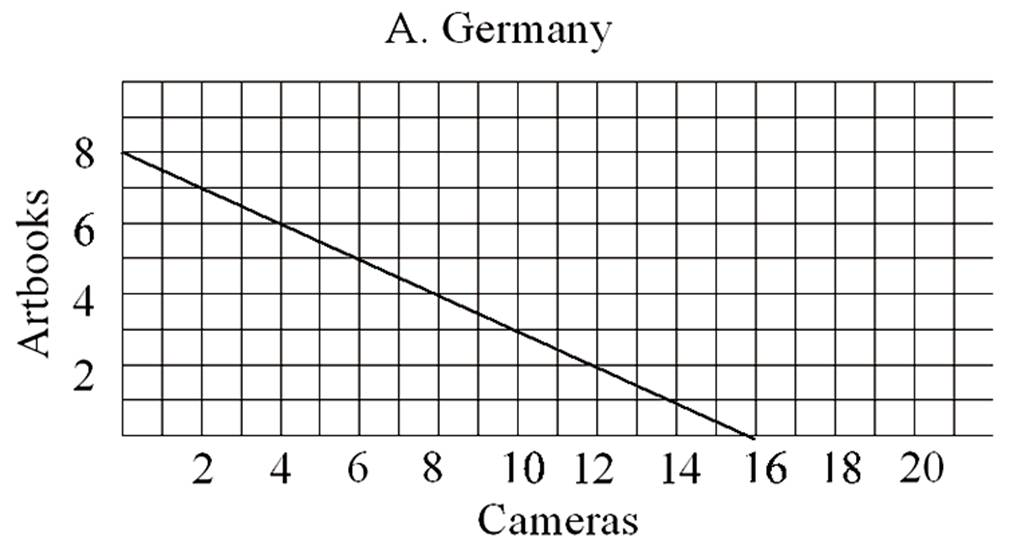
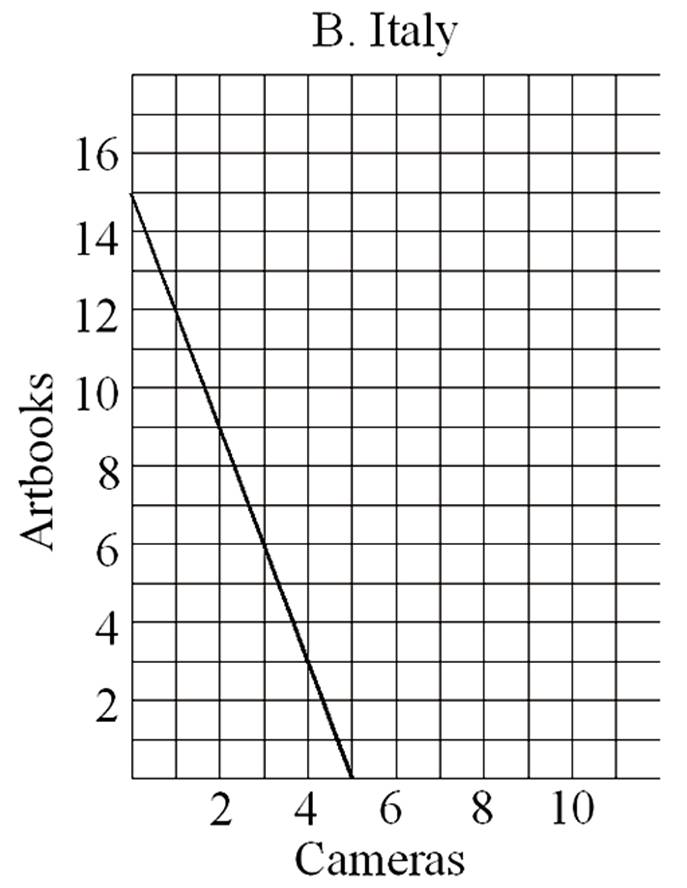
What is productivity?
What will be an ideal response?