Use the information given to draw a bar graph. Clearly label the bars. The following table shows the number of male infants born in a certain city on New Year's Day in various years. Make a horizontal bar graph to illustrate the data.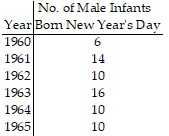
What will be an ideal response?
Answers may vary. The following is a possible answer.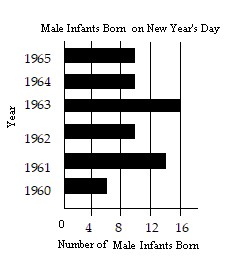
Mathematics
You might also like to view...
Provide an appropriate response.Define f(0,0) in a way that extends f(x, y) =  to be continuous at the origin.
A. f(0, 0) = 1 B. No definition makes f(x, y) continuous at the origin. C. f(0, 0) = 0 D. f(0, 0) = 2
Mathematics
Evaluate the expression.
A. 336 B. 6720 C. 20,160 D. 56
Mathematics
The two triangles below are similar. Find the unknown side lengths.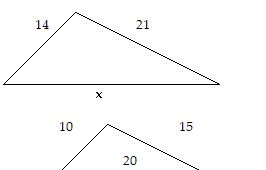
A. x = 35 B. x = 20 C. x = 26 D. x = 28
Mathematics
By calculating an appropriate number of terms, determine if the series converges or diverges. If it converges, find the limit L and the smallest integer N such that  for
for  otherwise indicate divergence.an =
A. L = 0, N = 8 B. diverges C. L = ln 4, N = 8 D. L = ln 2, N = 6
Mathematics