Solve the problem.The following table shows the median number of hours of leisure time per week for Americans in various years.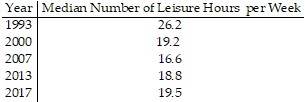 Let f(t) be the median number of hours of leisure time at t years since 1993. Use a graphing calculator to draw a scatterplot to describe the data. Using the same viewing window, draw the graph of the quadratic model
 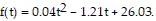 Use the model to estimate the years when the median number of hours of leisure time per week is 22.
What will be an ideal response?
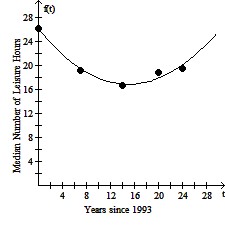
The median amount of leisure time per week is 22 hours in 1997 and in 2019.
You might also like to view...
Consider below the branching tree diagram based on the number per 3000 American adults.  LetT = the set of Americans who like classical music R = the set of Republicans who like classical music D = the set of Democrats who like classical music I = the set of Independents who like classical musicDetermine whether the statement is true or false.Let M = the set of Republican men who like classical music W = the set of Republican women who like classical musicIf x ? W, then x ? R.
A. True B. False
Between the pair of numbers, insert the appropriate sign: <, =, or >.

A. > B. < C. =
Multiply.


A. - 
B. - 
C. - 
D. 
Solve the equation.-y + 27 + 4y = 9 + 5y
A. y = -18 B. y = -9 C. y = 9 D. y = 18