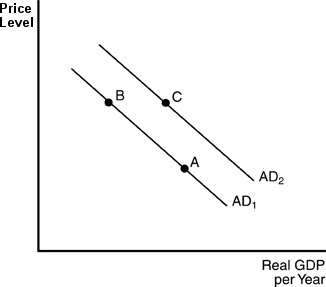
 In the above figure, a movement from point B to point A can be explained by
A. a drop in the price level.
B. an increase in the demand for manufacturing goods due to new technology.
C. an increase in spending due to increases in education expenditures.
D. an increase in spending due to a war.
Answer: A
You might also like to view...
Economic profit is ________
A) included in the firm's total opportunity cost B) equal to normal profit minus total opportunity cost C) equal to total revenue minus marginal cost D) equal to total revenue minus total opportunity cost
What does a firm's short-run total product curve show and what is its significance?
What will be an ideal response?
A new pollution law requires businesses to pay for inspections of their plants by independent pollution-monitoring firms. What effect is this likely to have?
A) Increase productivity B) Increase the capital stock C) Reduce productivity D) Increase the demand for labor in those firms
Measuring the impact of a quota or tariff on the U.S. economy is an example of ________. Stating that a quota or tariff should be eliminated is an example of ________
A) statistical analysis; economic analysis B) positive analysis; normative analysis C) econometric analysis; protectionism D) trade analysis; an opinion