Solve the problem.Suppose that during a certain step in a chemical manufacturing process the amount of hydrogen chloride dissolved in a solution, measured in parts per million (ppm), is related to the elapsed time measured from the beginning of the step. Use the following table as a representation of this relationship. Represent the data in the table graphically with elapsed time on the horizontal axis and the amount of dissolved hydrogen chloride on the vertical axis. What general trend do the data reflect?
What will be an ideal response?
With increasing elapsed time, the amount of dissolved hydrogen chloride increases.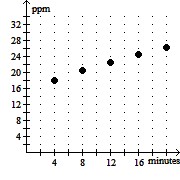
You might also like to view...
Solve. Round to the nearest hundredth, if necessary.According to Ohm's law, the electric current I, in amperes, in a circuit varies directly as the voltage V. When 17 volts are applied, the current is 4 amperes. What is the current when 21 volts are applied?
A. 4.94 amperes B. 42 amperes C. 4.25 amperes D. 89.25 amperes
Solve the problem.Momma's Ice Cream Shop sells three types of ice cream (soft-serve, chunky, and nonfat) at its three locations. The table below shows the number of gallons of each type sold per day at each location. 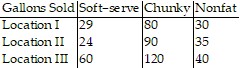 The income per gallon for soft-serve, chunky, and nonfat ice cream is $4, $6, and $8, respectively. Create two matrices to represent these data, and use matrix multiplication to find a matrix that gives the daily income at each location.
A. 
B. 
C. 
D. 
Graph the function.y = -  cos
cos  x
x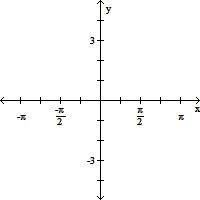
A. 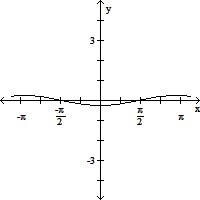
B. 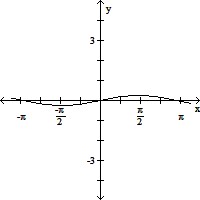
C. 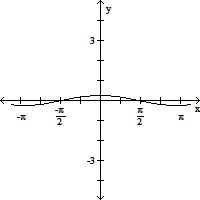
D. 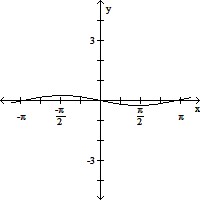
Find the standard equation of the parabola that satisfies the given conditions. Vertex: (-3, 2); directrix: y = 7
A. (y + 3)2 = -20(x - 2) B. (x + 3)2 = -20(y - 2) C. (x + 3)2 = -20(y + 2) D. (y + 3)2 = 8(x - 2)