True or false. For the function  gives the area between the graph of
  and the x-axis from
 ![]()
src="https://sciemce.com/media/3/ppg__cognero__Chapter_13_Definite_Integrals_Techniques_of_Integration__media__11ac6f97-0d05-4161-9a82-98af297dd54c.PNG" style="vertical-align: middle;" />.
?
Answer the following statement true (T) or false (F)
True
You might also like to view...
Evaluate the expression.3-2
A. -9
B. 9
C. 
D. 
Identify the sampling technique used to obtain a sample.In order to determine the expected number of broken eggs per carton, an egg packaging worker selects a group of 40 cartons that come off a particular conveyor belt and counts the number of broken eggs within these cartons.
A. Cluster sampling B. Stratified sampling C. Convenience sampling D. Random sampling
Decide if the statement is true or false.-23 ? -(-6)
A. True B. False
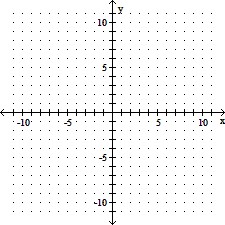
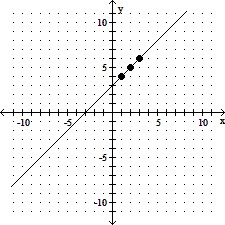
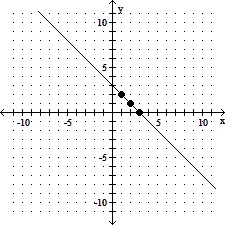
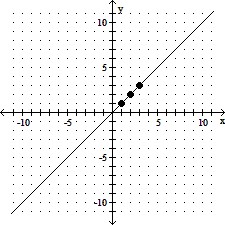
Graph the equation by determining the missing values needed to plot the ordered pairs.y + x = 3; (2, ), (3, ), (1, )
A. 
B. 
C. 
D. 