In the bar graphs below, a projection of population by age groups and gender for two different countries is given as a percent of the country's population at the time. Provide an appropriate response.Population Pyramids for Countries A and B: 2006 and 2050

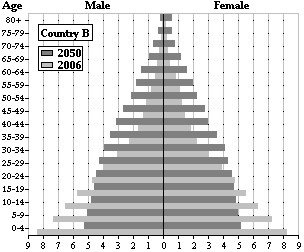 What is the 2006 female population for the 50-54 age group for Country A?
A. About 2.3%
B. About 3.5%
C. About 2.7%
D. About 1%
Answer: B
Mathematics
You might also like to view...
Solve the problem.The expected turnout at a company employee party is 55%. If there are 670 employees in the company, how many people should the caterer expect at the party? Round your answer to the nearest whole number.
A. 335 B. 364 C. 55 D. 369
Mathematics
Simplify. ?
? 
A. - 
B. 
C. 
D. 
Mathematics
Solve the formula for the specified variable. +
+  =
=  for c
for c
A. c = 
B. c = a + b
C. c = ab(a + b)
D. c = 
Mathematics
Find the composite function for the given functions and state the domain. f ? g for f(x) =  x and g(x) = -
  x
x
A. -x B. x C. 0 D. 1
Mathematics