Figure36-8
?
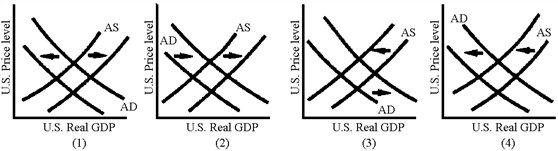
Which of the graphs in Figure 36-8 illustrates the AD–AS shifts associated with a currency depreciation?
A. 1
B. 2
C. 3
D. 4
Answer: C
You might also like to view...
Refer to Table 4-4. The table above lists the highest prices three consumers, Curly, Moe, and Larry, are willing to pay for a bottle of champagne. If the price of one of the bottles is $27 dollars, total consumer surplus will be
A) $0. B) $14. C) $26. D) $53.
What is the most common type of business?
A) partnership B) corporation C) sole proprietorship D) They are equally represented because of federal laws.
GDP underestimates our economic well-being:
a. for of all the following reasons. b. because it includes the value of work done by nannies. c. because it ignores leisure. d. because it includes the value of work done by householders. e. because it includes the value of work done by illegal immigrants.
Due to political instability in a country, there was a sudden decrease in the demand for goods. The unpredicted decrease in demand for goods caused a _____
a. macroeconomic shortage b. macroeconomic surplus c. budget surplus d. depression