Based on the diagram below, which of the following statements is true?
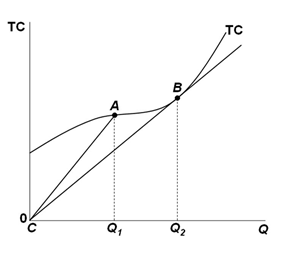
A. Average total cost at Q2 is the slope of line 0A
B. Average total cost at Q1 is the slope of line AB
C. Marginal cost at Q2 is the slope of line CB
D. Marginal cost at Q1 is the slope of line 0A
C. Marginal cost at Q2 is the slope of line CB
You might also like to view...
All of the following are critical functions of the government in facilitating the operation of a market economy except
A) enforcing contracts. B) ensuring an equal distribution of income to all citizens. C) protecting private property. D) enforcing property rights.
When Matt has an income of $2,000 . he consumes 30 units of good A and 50 units of good B. After Matt's income increases to $3,000 . he consumes 25 units of good A and 95 units of good B. Which of the following statements is correct?
a. Both goods A and B are normal goods. b. Both goods A and B are inferior goods. c. Good A is a normal good, and good B is an inferior good. d. Good A is an inferior good, and good B is a normal good.
which shows the production possibilities frontier for mufflers and socks. The opportunity cost of moving from point b to d is _____
a. equal to 30 mufflers. b. equal to 50 mufflers. c. equal to 100 socks. d. equal to 150 socks. e. equal to 250 socks.
Refer to the information provided in Figure 19.1 below to answer the question(s) that follow. 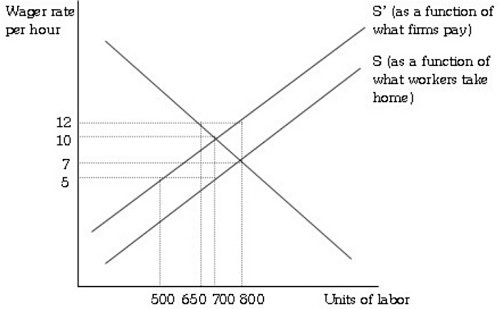 Figure 19.1 Refer to Figure 19.1. The payroll tax imposed initially
A. reduced the equilibrium wage rate by $5 per hour. B. did not change the equilibrium wage rate. C. increased the equilibrium wage rate by $3 per hour. D. reduced the equilibrium wage rate by $3 per hour.