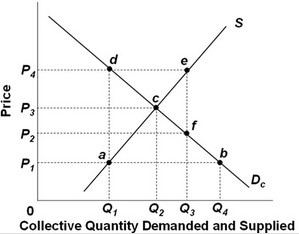
 Refer to the above supply and demand graph for a public good. Point c on the graph shows where the:
A. average benefit equals the average cost of the public good.
B. total benefit equals the total cost of the public good.
C. total benefit equals the marginal cost of the public good.
D. marginal benefit equals the marginal cost of the public good.
Answer: D
You might also like to view...
The Exxon Valdez oil spill was an exception to the rule. It was the only major environmental disaster in the 1980s
Indicate whether the statement is true or false
According to the accompanying table, Martha has the absolute advantage in making: Time to Make a PieTime to Make a CakeMartha60 minutes80 minutesJulia50 minutes60 minutes
A. both pies and cakes. B. pies. C. neither pies nor cakes. D. cakes.
A retail shop has an outside display which has the time and temperature that is always correct. This is an example of
A. a negative externality. B. a positive externality. C. an interference in the workings of the price system. D. a breakdown in communication between the shop and its customers.
The number of seats available in an arena is fixed at 20,000. The equilibrium price for a ticket to a basketball game at the arena is $80. The equilibrium price for a ticket to a hockey game at the arena is $95. Which of the following is true?
A. The demand for hockey games must be more elastic than the demand for basketball games. B. The demand for each hockey game must be higher than the demand for each basketball game. C. The supply of hockey games must be less elastic than the supply of basketball games. D. Basketball games must be more expensive to produce than hockey games.