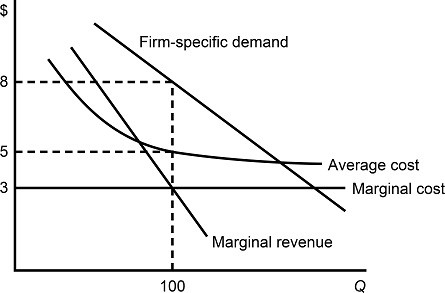
 Figure 8.4 depicts demand and costs for a monopolistically competitive firm. If the firm's demand curve shifts to the left as more firms enter the market:
A. the firm's profit will be smaller at the new profit-maximizing output level.
B. the firm's profit will be greater at the new profit-maximizing output level.
C. the firm's profit will remain the same at the new profit-maximizing output level.
D. There is not sufficient information.
Answer: A
You might also like to view...
The outcome of the state of nature effects the payoff to the agent under a
A) fixed-fee contract. B) hire contract. C) contingent contract. D) All of the above.
Regulation of monopolies that allows prices to reflect only the actual cost of production and no monopoly profits is referred to as
A) cost-of-service regulation. B) rate-of-return regulation. C) service-opportunity regulation. D) natural regulation.
The branch of economics that attempts to understand the outcomes observed in the public sector by examining the incentives faced by the individual actors involved (such as voters, politicians, and bureaucrats) is known as
a. private choice analysis. b. public choice analysis. c. government operations analysis. d. incentive analysis.
Exhibit 10-6 Aggregate supply curve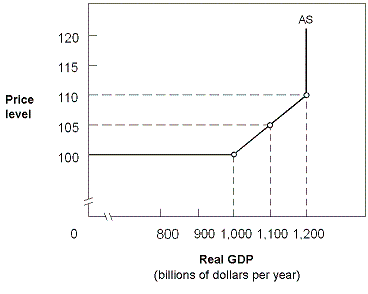 In Exhibit 10-6, the economy's employment potential is fully exhausted at:
A. GDP = $1,000 billion. B. GDP = $1,100 billion. C. GDP = $1,200 billion. D. the employment potential is never fully exhausted.