Solve the problem. Where appropriate, round to the nearest tenth of a percent.The graph below shows a certain country's peanut production in thousands of pounds for the years 2004, 2006, 2008, 2010, and 2012. Find the percent increase in peanut production from 2008 to 2010.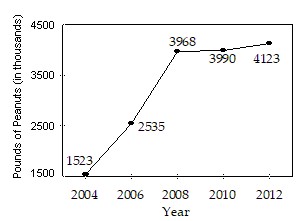
A. 0.0060%
B. 0.6%
C. 3.3%
D. 0.0330%
Answer: B
Mathematics
You might also like to view...
Find the indicated cardinal number.Find n(A × C) given that A = {2} and C = {4, 5, 6}.
A. 2 B. 3 C. 4 D. 1
Mathematics
Determine the indefinite integral. Check your work by differentiation. dx
dx
A. -  -
-  + C
+ C
B. C
C.  - 2
- 2 + C
+ C
D. 2 -
-  + C
+ C
Mathematics
Use a sum or difference identity to find the exact value.
A. 
B. 
C. 
D. 
Mathematics
Use regression to find a quadratic function that best fits the data. Give results to the nearest hundredth.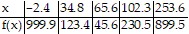
A. f(x) = 0.15x2 + 38.67x + 891.67 B. f(x) = 0.05x2 - 13.25x + 790.18 C. f(x) = 0.15x2 - 38.67x + 891.67 D. f(x) = 0.05x2 + 13.25x + 790.18
Mathematics