Use the figure below, which shows a linear demand curve and the associated total revenue curve, to answer the question. The maximum possible total revenue is $________.
A. 11,000
B. 10,500
C. 11,500
D. 12,500
E. 12,000
Answer: D
You might also like to view...
To measure the amount of tax money collected by the government, one uses the vertical distance between points
The accompanying diagram shows the effect of levying an income tax on the consumer. The pre-tax optimum is at point A, and the post-tax optimum is at point B.
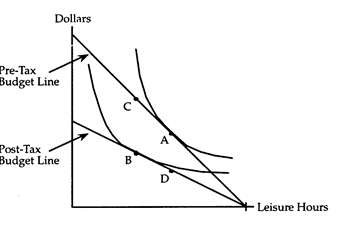
a. A and B.
b. A and D.
c. B and C.
d. B and D.
Aggregate demand refers to the relationship between
A) the price level and the quantity of real GDP supplied. B) prices and the quantity of a good supplied. C) the price level and the quantity of real GDP demanded. D) prices and the quantity of a good demanded.
The welfare effects of a quota depend, to considerable extent, upon
A) who has the quota license. B) the size of the quota. C) elasticities of domestic demand and supply. D) all of the above.
Suppose the nominal interest rate is 7 percent annually, and you deposit $1,000. Inflation in the economy throughout the year is 7 percent. At the end of the year, you have earned:
A. an increase in your purchasing power. B. no increase in your savings. C. no increase in your purchasing power. D. a decrease in your purchasing power.