Using the Figure 13.3 above explain why this firm could not possibly represent a monopolist. What type of firm is represented by this graph and why?
What will be an ideal response?
This firm couldn't be a monopolist since monopolists face a downward-sloping demand curve. This firm is a perfectly competitive firm since the demand curve indicates that it is a price taker.
You might also like to view...
Suppose the daily demand for Coke and Pepsi in a small city are given by QC = 90 - 100PC + 400(PP - PC) and QP = 90 - 100PP + 400(PC - PP), where QC and QP are the number of cans Coke and Pepsi sell, respectively, in thousands per day. PC and PP are the prices of a can of Coke and Pepsi, respectively, measured in dollars. The marginal cost is $0.45 per can for both Coke and Pepsi. What is Pepsi's best response function?
A. QP = 200PC - 67.5 B. QP = (90 + 400PC) - 500PP C. PP = 0.315 + 0.4PC D. PP = (0.18 + 0.8PC) - 0.002QP
The firm's demand for labor curve is exactly the same as the:
a. wage rate. b. price of the output. c. MRP curve. d. MP curve. e. labor supply curve.
In the long run, the price level in an economy is determined solely by:
a. the aggregate demand curve. b. the amount of cyclical unemployment in the economy. c. the long-run aggregate supply curve. d. the short-run aggregate supply curve. e. the actual output level.
Exhibit 9-7 Monopolist
?
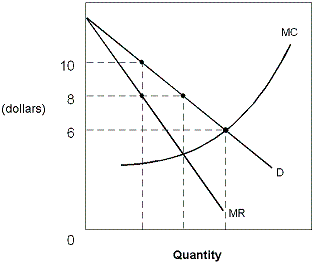 If the profit-maximizing monopoly in Exhibit 9-7 becomes a profit-maximizing perfectly competitive market, the price will go from
A. $8 to $6. B. $10 to $8. C. $10 to $6. D. $6 to $8.