Use the information given to draw a bar graph. Clearly label the bars. The following table shows the number of female infants born in a certain city on New Year's Day in various years. Make a vertical bar graph to illustrate the data.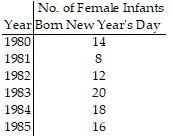
What will be an ideal response?
Answers may vary. The following is a possible answer.
Mathematics
You might also like to view...
Divide. Write with positive exponents.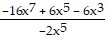
A. 8x - 3 + 
B. 8x - 3 + 
C. 8x2 - 3 + 
D. 8x2 - 3 + 
Mathematics
Change the given polar coordinates (r, ?) to Cartesian coordinates (x, y).(4, 0)
A. (-4, 0) B. (0, -4) C. (4, 0) D. (0, 4)
Mathematics
Perform the calculation.180° - 148°52'16"
A. 32°8'44" B. 31°7'44" C. 32°7'44" D. 31°8'44"
Mathematics
If the set W is a vector space, find a set S of vectors that spans it. Otherwise, state that W is not a vector space.W is the set of all vectors of the form  , where a and b are arbitrary real numbers.
A.  ,
,  ,
, 
B.  ,
, 
C. Not a vector space
D.  ,
, 
Mathematics