Graph a and graph b have several differences. What difference between the two shows a failure to meet productive efficiency?
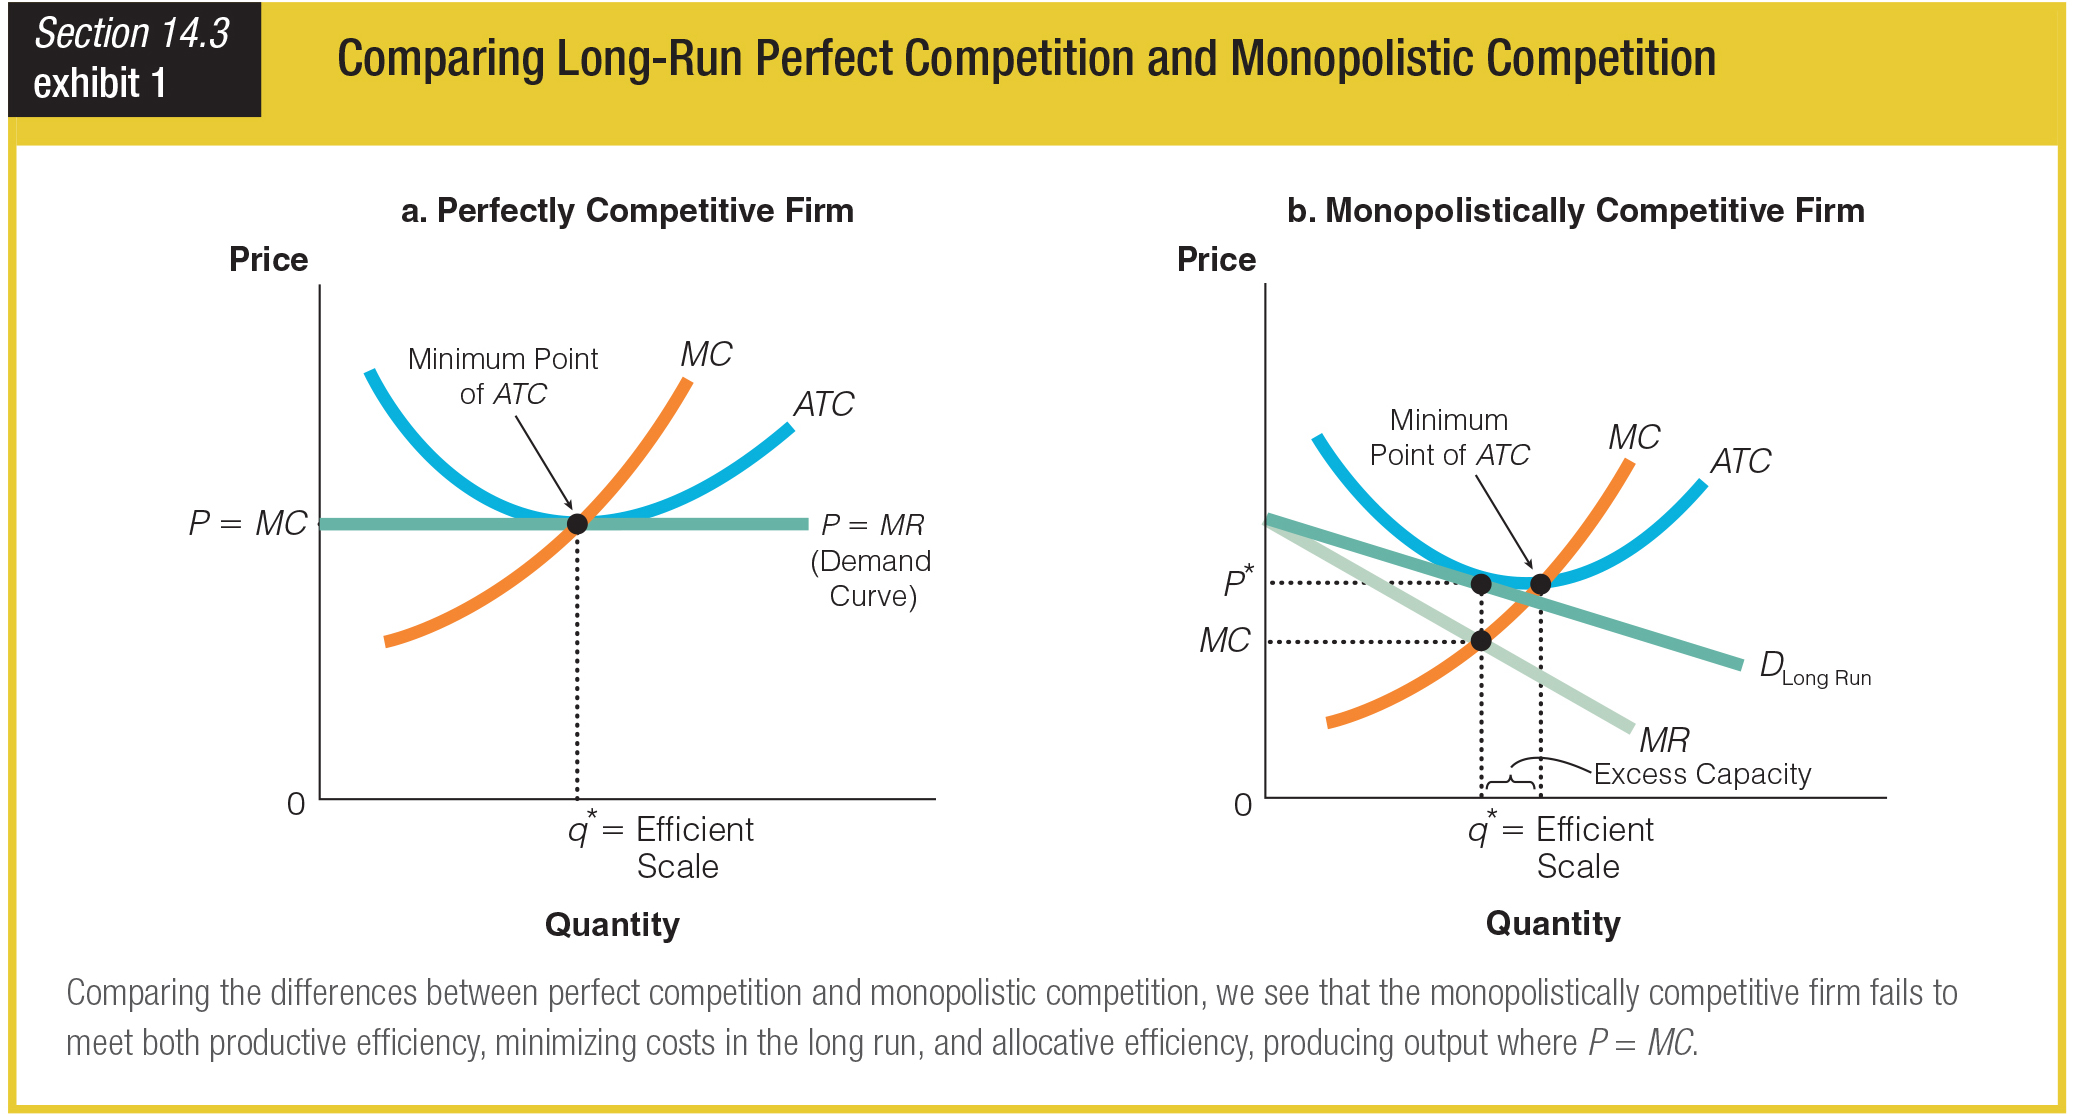
a. In graph a, ATC touches the demand curve at P equals MC.
b. In graph b, the demand curve is downward sloping.
c. In graph a, P equals both MR and MC.
d. In graph b, MC is less than P*, and q* is less than it could be.
d. In graph b, MC is less than P*, and q* is less than it could be.
You might also like to view...
To maximize profit, a monopolist will produce and sell a quantity such that for the last unit sold, marginal revenue equals marginal cost, and charges a price given by the demand curve at that output level
Indicate whether the statement is true or false
Refer to the information above. What is the level of consumption when the level of income is 850?
A) 375 B) 425 C) 450 D) 475
If the Fed wanted to shift to a restrictive monetary policy and reduce the money supply, it could
a. increase the interest rate paid on excess reserves encouraging banks to extend more loans. b. decrease the interest rate paid on excess reserves encouraging banks to extend more loans. c. decrease the interest rate paid on excess reserves encouraging banks to hold excess reserves rather than extend more loans. d. increase the interest rate paid on excess reserves encouraging banks to hold excess reserves rather than extend more loans.
Scarcity is defined as the condition in which
A) both wants and resources are limited. B) wants are finite and resources infinite. C) both wants and resources are infinite. D) wants are infinite and resources finite.