In the above figure, along which range would total revenue rise by lowering prices?
A) between point a and point b
B) between point c and point d
C) between point d and point e
D) below point e
A
You might also like to view...
The number of US households with access to the Internet is growing rapidly. Compared to 50 years ago, one would predict that when considering a major purchase, people today will gather:
A. more information because the Internet has lowered the cost of gathering information. B. less information because the Internet has lowered the cost of gathering information. C. more information because the Internet has increased the cost of gathering information. D. less information because the Internet has increased the benefit of gathering information.
Which of the following is the most likely candidate for a decreasing-cost industry?
a. airlines b. oil c. construction d. computers
High monopoly profits are possible if each of the oligopolists in a market: a. cooperates by reducing its output
b. cooperates by reducing its price. c. pursues self-interest by increasing its output. d. pursues self-interest by decreasing its output.
In the graph for the relationship between elasticity of the demand and total revenue, we can see that between five and ten units, ______.
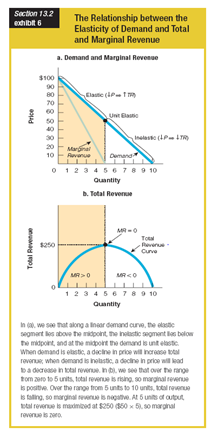
a. total revenue is rising and marginal revenue is positive
b. total revenue is rising and marginal revenue is negative
c. total revenue is falling and marginal revenue is positive
d. total revenue is falling and marginal revenue is negative