Provide an appropriate response.You brake your car from a speed of 55 mph. The table shows data that represent your car's speed versus the amount of time elapsed from the moment that you began to brake.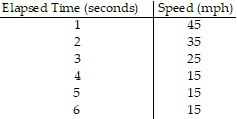 The graph below displays the data in the table. Refer to the graph to answer the questions.Speed (mph)
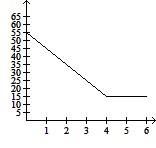 Elapsed Time (seconds)(i) For what interval of time is the speed of your car increasing? (ii) For what interval of time is the speed of your car decreasing? (iii) For what interval of time is the speed of your car constant?
A. (i) 0 to 4 seconds
(ii) None
(iii) 4 to 6 seconds
B. (i) 0 to 5 seconds
(ii) None
(iii) 5 to 6 seconds
C. (i) None
(ii) 0 to 4 seconds
(iii) 4 to 6 seconds
D. (i) None
(ii) 0 to 5 seconds
(iii) 5 to 6 seconds
Answer: C
You might also like to view...
Find two paths of approach from which one can conclude that the function has no limit as (x, y) approaches (0, 0).f(x, y) = 
What will be an ideal response?
Find the indicated quantity.Find the radius of gyration with respect to its axis of the volume generated by revolving the region bounded by  and the
  about the
A. 

B. 

C. 

D. 
Write a formula for the general term, or nth term, for the given sequence. ,
,  ,
,  ,
,  , . . .
A. an = 
B. an = 
C. an = 
D. an = 
Find the slope of the tangent line to the graph at the given point.f(x) = 2x2 + x - 3 at (4, 33)
A. 5 B. 19 C. 17 D. 15