Refer to Table 1.4 (in Section 1.3).
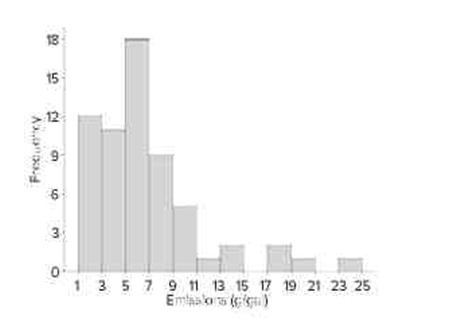
a. Using the class intervals in the table, construct a histogram in which the heights of the rectangles are equal to the frequencies.
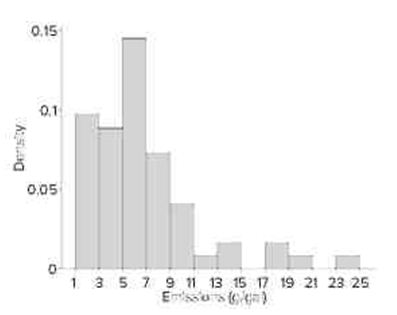
b. Using the class intervals in the table, construct a histogram in which the heights of the rectangles are equal to the densities.
c. Compare the histograms in parts (a) and (b) with the histogram in Figure 1.8, for which the heights are the relative frequencies. Are the shapes of the histograms the same?
(a)
(b)
(c) Yes, the shapes of the histograms are the same.
You might also like to view...
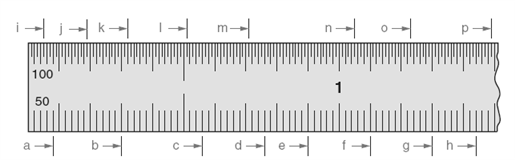 In the accompanying figure, measurement a has a value of ____________________ inches.
Fill in the blank(s) with the appropriate word(s).
List the common sizes of acetylene cylinders
What will be an ideal response?
When troubleshooting an air-to-air heat pump, the technician notices that warm air is coming out of the indoor coil during a call for cooling. What is the most likely problem?
A. defective room thermostat B. defective reversing valve C. defective compressor D. defective defrost control E. a or b
Calculate the true power in a 2A series RL circuit with a 100? resistor
a. 50W b. 200W c. 400W d. 600W