For each data set shown by the table, a. Create a scatter plot for the data.b. Use the scatter plot to determine whether an exponential function, a logarithmic function, or a linear function is the best choice for modeling the data.Number of Homes Built in a Town by Month
What will be an ideal response?
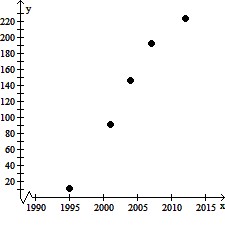
Exponential function
Mathematics
You might also like to view...
Sketch the vectors u and w with angle ? between them and sketch the resultant. = 8,
= 8,  = 16, ? = 15°
A. 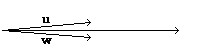
B. 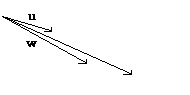
Mathematics
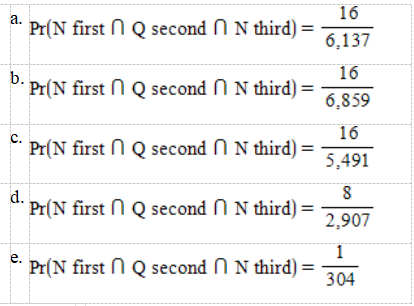
A bag contains 2 nickels, 9 dimes, and 8 quarters. If you draw 3 coins at random from the bag, without replacement, what is the probability that you will get a nickel (N), a quarter (Q), and a nickel (N), in that order?
Mathematics
Solve and graph.-7 ? 
A. b ? -28
![]()
B. b < -28
![]()
C. b > -28
![]()
D. b ? -28
![]()
Mathematics
Find the volume of the solid of revolution formed by rotating about the x-axis the region bounded by the curves.f(x) =  , y = 0, x = 1, x = 18
A. 323? B. 8.5? C. 161.5? D. 162?
Mathematics