Refer to the graph shown. Assume the market is initially in equilibrium at point b in the graph but the imposition of a per-unit tax on this product shifts the supply curve up from S0 to S1. The welfare loss triangle from this tax is represented by area: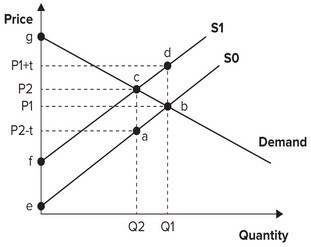
A. cfg.
B. abdc.
C. beg.
D. abc.
Answer: D
You might also like to view...
Residential investment plunged quite noticeably ________ the start of the 1973-1975 and 1981-1982 recessions, with the prospect that recent financial deregulation would make it ________ sensitive to future changes in monetary policy
A) after, more B) after, less C) before, more D) before, less
Suppose a consumer is spending all of his/her income on two goods, A and B, in a manner where MUa = 15 and MUb = 75, and the Pa = $3 and the Pb = $15, then the consumer:
a. is maximizing his/her utility. b. should increase his/her purchases of B and decrease the purchases of A. c. should spend more money on both goods. d. should spend less money on both goods. e. should increase the purchases of A and decrease the purchases of B.
Which of the following are characteristics of a Perfectly Competitive Industry?
(a) Few buyers and sellers. (b) Heterogeneous products. (c) Homogeneous products. (d) Barriers to entry and exit.
The budget line will shift parallel to the right if:
A. income increases. B. income decreases. C. the price of the good on the vertical axis increases. D. the price of the good on the vertical axis decreases.