Use the following graph to answer the next question.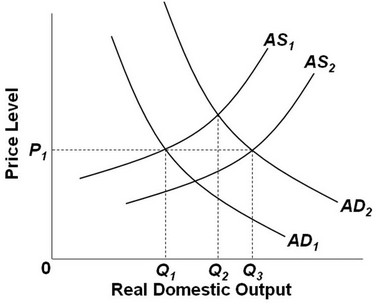 In the figure, AD2 and AS2 represent the original aggregate supply and demand curves. If Q3 is full-employment output, then AD1 and AS2 represent a(n) ________.
A. full-employment
B. expansion
C. price stability
D. recession
Answer: D
You might also like to view...
In the simple Keynesian model of the determination of income, the price level is assumed to be
A) exogenous and to gradually change. B) endogenous and to gradually change. C) exogenous and to remain constant. D) endogenous and to remain constant.
Which of the following is true of marginal cost?
a. Marginal cost is the cost per unit of output produced. b. Marginal cost is the change in total cost divided by the change in total output. c. Marginal cost curve is negatively sloped at the profit-maximizing level of output. d. Marginal cost is equal to total cost divided by the quantity of output. e. Marginal cost initially increases with an increase in output but subsequently declines.
Jenni can change a car's oil in 10 minutes and clean a bathroom in 20 minutes. Rob can change a car's oil in 20 minutes and clean a bathroom in 10 minutes. Therefore,
a. Jenni should clean the bathroom and Rob should change the car's oil b. Rob should clean the bathroom and Jenni should change the car's oil c. there are no gains from specialization d. Rob has an absolute advantage in both activities e. Jenni has an absolute advantage in cleaning the bathroom
Evaluate the following: "Employers who discriminate against women will have lower costs than rival firms that hire employees strictly on the basis of merit (productivity)."