Figure 11-3
?
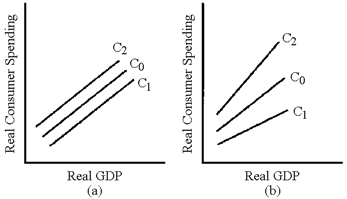
In Figure 11-3, which line represents the change in the consumption schedule caused by an increase in the personal income tax?
A. C1 in graph (a)
B. C2 in graph (a)
C. C1 in graph (b)
D. C2 in graph (b)
Answer: C
You might also like to view...
The current exchange rate system for most currencies is described most accurately as one of
a. fixed exchange rates. b. freely flexible exchange rates. c. gold standard rates. d. dirty or managed floating.
In the presence of serial correlation:
A. estimated standard errors remain valid. B. estimated test statistics remain valid. C. estimated OLS values are not BLUE. D. estimated variance does not differ from the case of no serial correlation.
Economies of scale involve a reduction in minimum average costs as a result of an increase in the size of plants and equipment.
Answer the following statement true (T) or false (F)
Which of the following is a TRUE statement about the relationship between the price of bonds and the interest rate?
A. The prices of bonds increase when the interest rates rise. B. The prices of bonds are unrelated to the interest rate. C. The prices of bonds are inversely related to the interest rate. D. The prices of bonds are directly related to the interest rate.