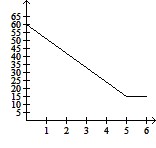
Solve the problem.You brake your car from a speed of 60 mph. The table shows data that represent your car's speed versus the amount of time elapsed from the moment that you began to brake.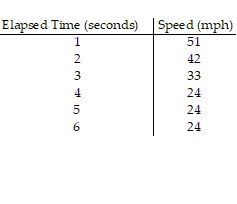
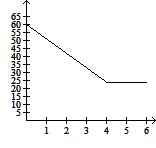
 Graph the data. For what interval of time is the speed increasing? For what interval of time is the speed decreasing? For what interval of time is the speed constant?
A. 
| Elapsed Time (seconds) |
0 to 4 seconds; None; 4 to 6 seconds
B.

| Elapsed Time (seconds) |
0 to 5 seconds; None; 5 to 6 seconds
C.


| Elapsed Time (seconds) |
None; 0 to 4 seconds; 4 to 6 seconds
D.

| Elapsed Time (seconds) |
None; 0 to 5 seconds; 5 to 6 seconds
Answer: C
Mathematics
You might also like to view...
The graph of a function f is given. Use the graph to answer the question.Is f(60) positive or negative?
A. positive B. negative
Mathematics
Determine independence. Answer Yes or No.The table shows the political affiliation of voters in one city and their positions on stronger gun control laws. ?Stronger Gun Control 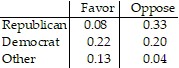 Are party affiliation and position on gun control laws independent?
A. Yes B. No
Mathematics
Write the equation for the line in the standard form.Containing (-7, -3) and parallel to the graph of 5x + 6y = 1.
A. 5x + 6y = -17 B. 6x + 5y = -53 C. 5x + 6y = -53 D. 5x + 6y = -35
Mathematics
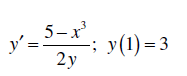
Solve the initial-value problem.
Mathematics