Refer to the following graphs to answer the question below.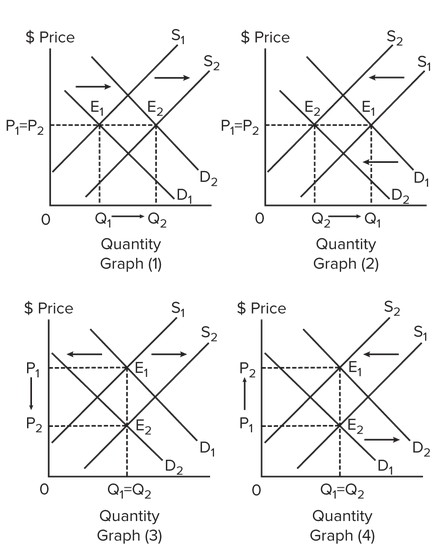 Select the graph that best shows the changes in demand and supply in the beef market if a new diet fad favoring beef consumption becomes hugely popular, while cattle producers see steeply rising costs of cattle feed.
A. graph (1)
B. graph (2)
C. graph (3)
D. graph (4)
Answer: D
You might also like to view...
In a Dutch auction, the starting bid is ________
A) far above any bidder's value for the good being auctioned B) far below any bidder's value for the good being auctioned C) far below the market price of the good D) equal to the market price of the good
Usually the demand for labor decreases (that is, the demand for labor curve shifts leftward) if the
A) wage rate increases. B) wage rate decreases. C) price of the firm's output rises. D) prices of other factors fall.
In the Stackelberg model, the leader has a first-mover advantage because it
A) has lower costs than the follower.
B) commits to producing a larger quantity.
C) reacts to the follower's decision.
D) differentiates its output.
Suppose that a fully employed economy produces only two goods, hamburgers and flat-panel TVs. If the economy is currently producing more than the optimal quantity of hamburgers, then to attain the optimal allocation of resources it should:
A. produce more hamburgers and fewer TVs. B. produce more TVs and fewer hamburgers. C. produce more of both goods. D. produce fewer of both goods.